Personalize a Dashboard
Personalization Mode allows you to modify a dashboard to your personal preferences. This allows you to add, delete, and rearrange visualizers on a dashboard. In addition, you can organize a group of one or more visualizers into a zone.
The available options for personalization are dependent on the type of dashboard you are accessing. For example, some portions of the dashboard, such as the header, may be locked, which means that you cannot add or edit any of the content in those areas. Headers display in a yellow box and do not have editable areas. Areas that are editable have zone captions that can be edited.
Access Personalization Mode
- Click the View
 button and then select the Personalization Mode option.
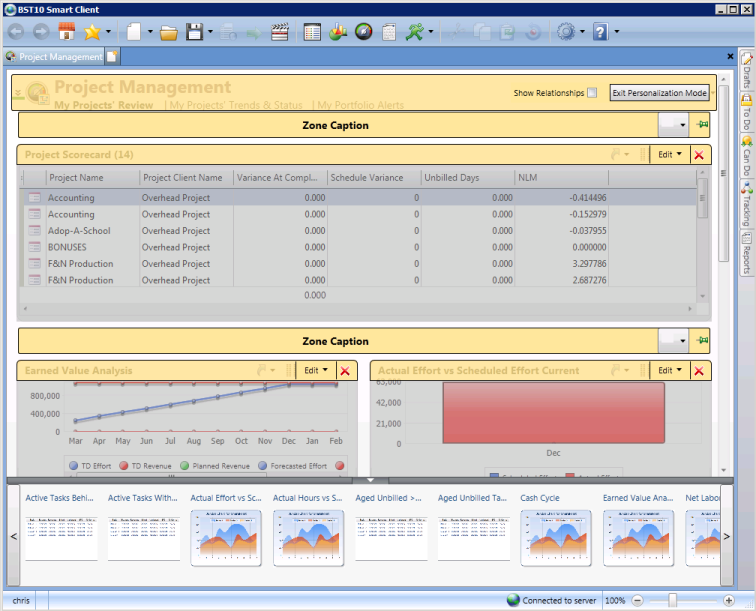
The dashboard displays in Personalization Mode.
Work with Zones
Zones are used to break dashboards down into sections of data and contain a grouping of one or more visualizers. Each zone is denoted by a bar with a heading title.
- Pin a Zone: A zone can be pinned so it does not move when you scroll the dashboard screen. To pin a zone, click the pin
 button on the zone heading. Once pinned, the pinned
  button displays.
 - Name a Zone: To rename a zone caption, click on the zone heading and then enter new text. When a heading has not been defined, Zone Caption displays.
Add a Visualizer
When in Personalization Mode, a visualizer carousel displays at the bottom of the screen. This includes a list of visualizers that you can add to the dashboard. For information about all of the visualizers that are included in BST11, see Visualizers Overview.
- From the visualizer carousel at the bottom of the screen, click, hold, and pull a visualizer with your cursor.
Various docking controls display on the screen. A blue shaded area displays where the visualizer will be added. These controls move and adjust based on where you drag the visualizer on the screen.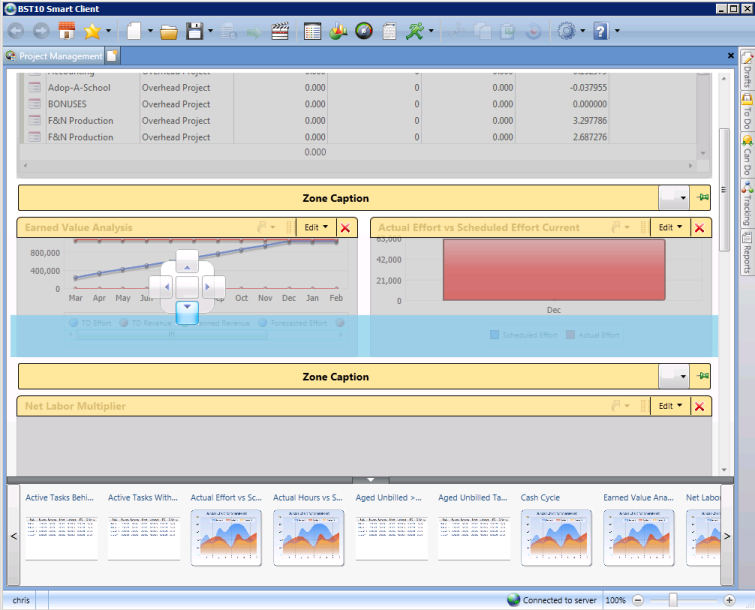
-
Drag the tab to one of the docking controls. As you drag, a blue bar will display the general area where the visualizer will be added. When you let go of the visualizer, it is added to the new location. The following options are available:
Button Description 
When you drag a visualizer onto a dashboard, this control allows you to add and move a visualizer to a specific location on the dashboard.
The above, left, right, and below
 buttons allow you to add the visualizer to a zone in relation to the other visualizers already added. The area of the screen and the button that represents the visualizer will be added is highlighted blue.
Move Visualizers
To change how and where a visualizer is displayed on a dashboard, use the following steps:
- Click, hold, and pull a tab with you cursor.
Various docking controls display on the screen. A blue shaded area displays where the visualizer will be moved. These controls move and adjust based on where you drag the visualizer on the screen. -
Drag the tab to one of the docking controls. As you drag, a blue bar will display the general area where the visualizer will be added.
When you let go of the visualizer, it is moved to the new location.
Related Visualizers
To understand how zones and visualizers relate to one another, highlight an item in the main list, and click the Show Relationships box next to the Exit Personalization Mode option. The visualizers related to the list item will be pointed to by blue arrows.
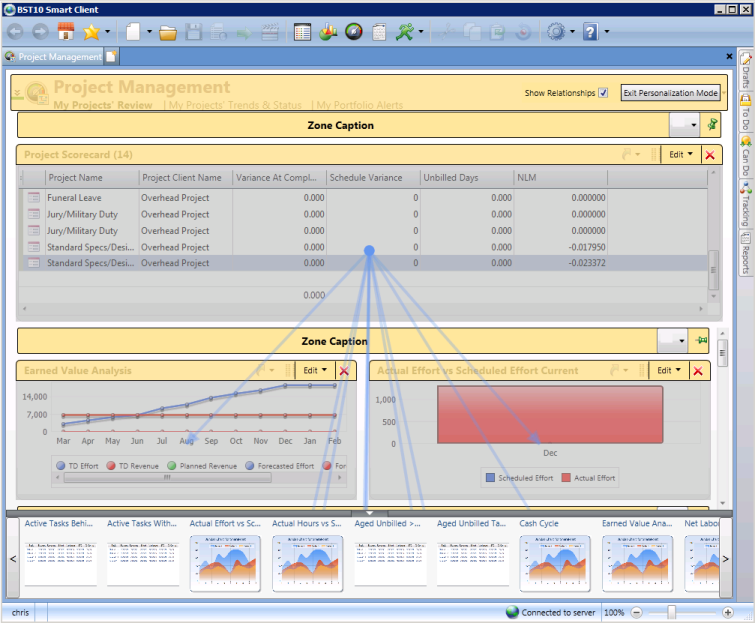
The intrinsic nature of the relationship is not modifiable here. The definition of the relationship is created when the list and visualizer are defined in the BST Design Suite.
Save Changes and Exit Personalization Mode
Once you have made the necessary changes to the dashboard, exit from personalization mode to save your changes.
- In the yellow bar over the dashboard title, click the Exit Personalization Mode button.
The screen changes back to the normal dashboard view with your changes displayed. - When you exit, save your preferences as a view. For more information, see Manage Views.